DAILY RAINFALL DATA FOR SOUTHEAST KANSAS
(SOUTHEAST KANSAS COCORAHS DATA)
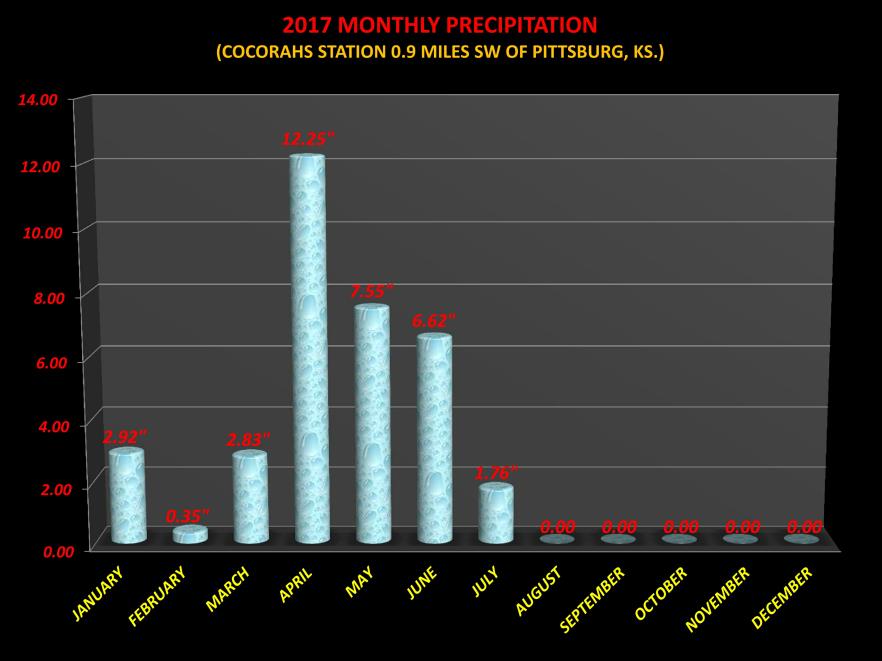
MONTHLY RAINFALL DATA FOR SOUTHEAST KANSAS
(COCORAHS STATION 0.9 SW OF PITTSBURG, KANSAS)
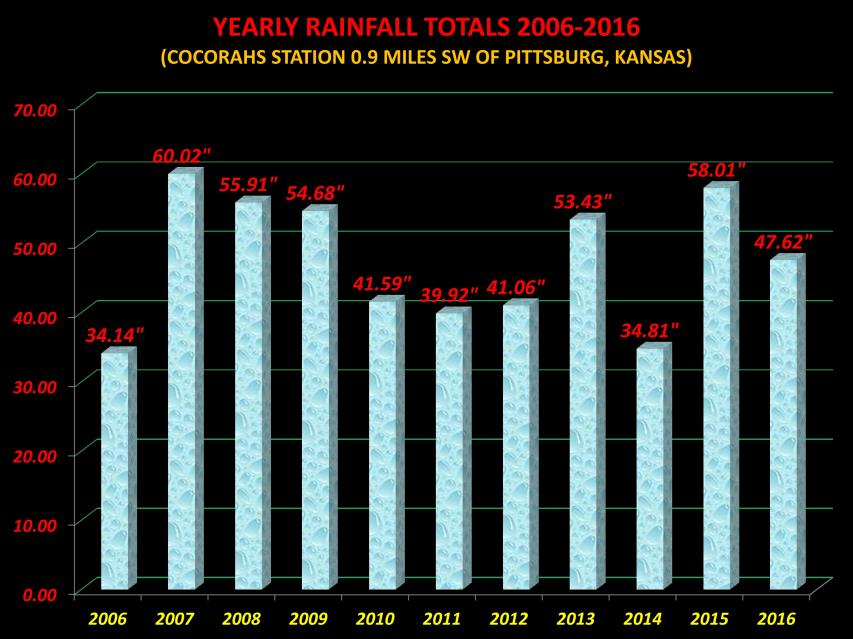
YEARLY RAINFALL DATA FOR SOUTHEAST KANSAS
(COCORAHS STATION 0.9 SW OF PITTSBURG, KANSAS)