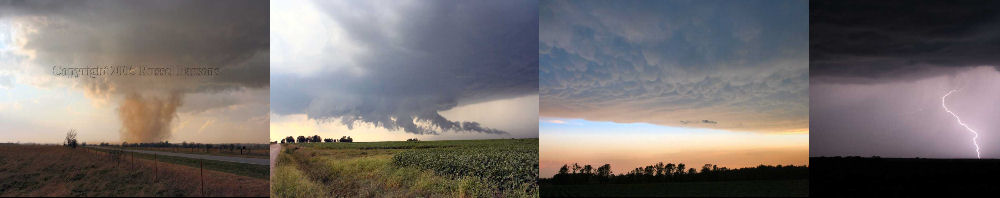
RADAR AND SATELLITE
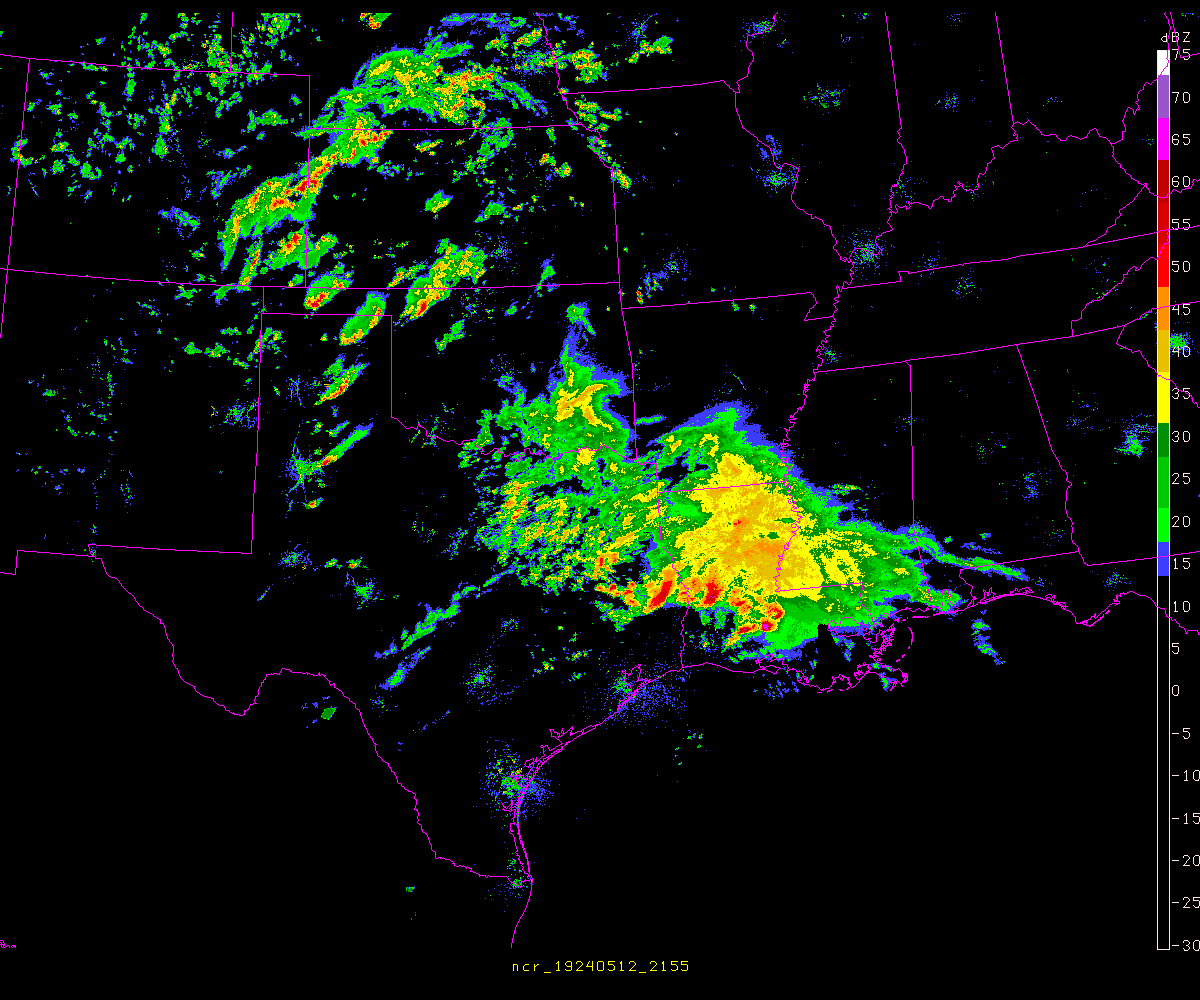
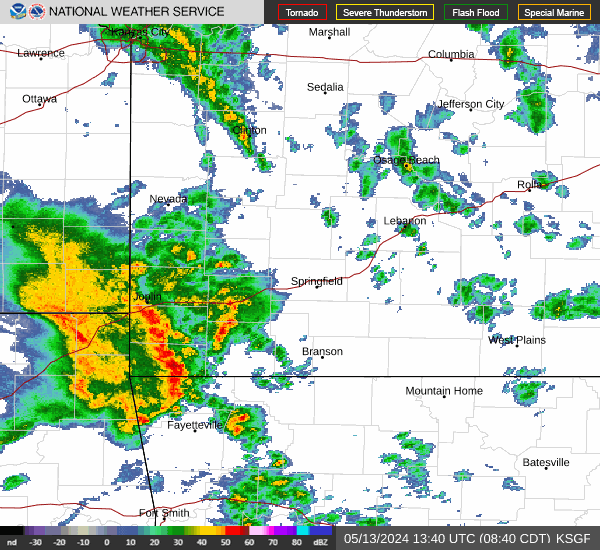
NEXRAD WEATHER RADAR REGIONAL SITES
NEXRAD WEATHER RADAR SINGLE SITES
 | ||||||
| ||||||
Description Of NEXRAD Weather Radar (Taken From Wikipedia)
NEXRAD or Nexrad (Next-Generation Radar) is a network of 158 high-resolution Doppler radars operated by the National Weather Service, an agency of the National Oceanic and Atmospheric Administration (NOAA) within the United States Department of Commerce. Its technical name is WSR-88D, which stands for Weather Surveillance Radar, 1988, Doppler.
NEXRAD detects precipitation and atmospheric movement or wind. It returns data which when processed can be displayed in a mosaic map which shows patterns of precipitation and its movement. The radar system operates in two basic modes, selectable by the operator: a slow-scanning clear-air mode for analyzing air movements when there is little or no activity in the area, and a precipitation mode with a faster scan time for tracking active weather. NEXRAD has an increased emphasis on automation, including the use of algorithms and automated volume scans. Weather radar tutorials can be found here and here
Click On Your Area On The Map Below, And You Will Be Taken To The Current NEXRAD National Weather Service Weather Radar Site
 | ||||
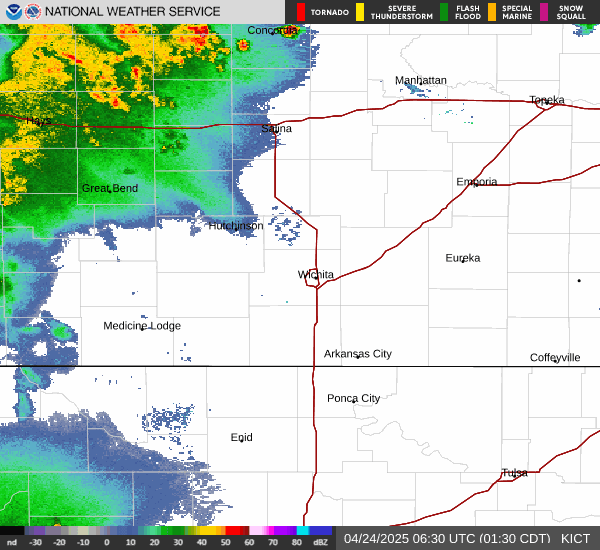 | ||||
These Two Sites Will Also Give You Some Other Single Site NEXRAD Weather Radar Options
WEATHER SATELLITE IMAGES
Infrared Weather Satellite Images
The satellite also measures the temperature of the clouds and the surface of the Earth with an infrared sensor. This allows for the detection of changes in the temperature of clouds and that of the surface during the day and at night. Clouds are usually colder than the surface (land or water). The temperature of the clouds also indicates how tall they are since temperature is inversely proportional to height in the atmosphere. With colorized infrared imagery, gray is relatively warm, blues cooler, red indicates clouds that are the coldest, tallest, and most likely to produce rain.
The colder the cloud the more likely it is to produce rain. The temperature structure of clouds also tells the meteorologist how hard it may be raining and whether the storm may be producing severe weather. In the absence of clouds, the satellite measures the temperature of the surface, which could be land or ocean.
The infrared image can also be used to monitor sea-surface temperature (SST). Since about 70% of the Earth is ocean, this allows the scientist to study how changes in SST (such as El Nino and La Nina) are related to global weather events (such as droughts, hurricanes, and floods).

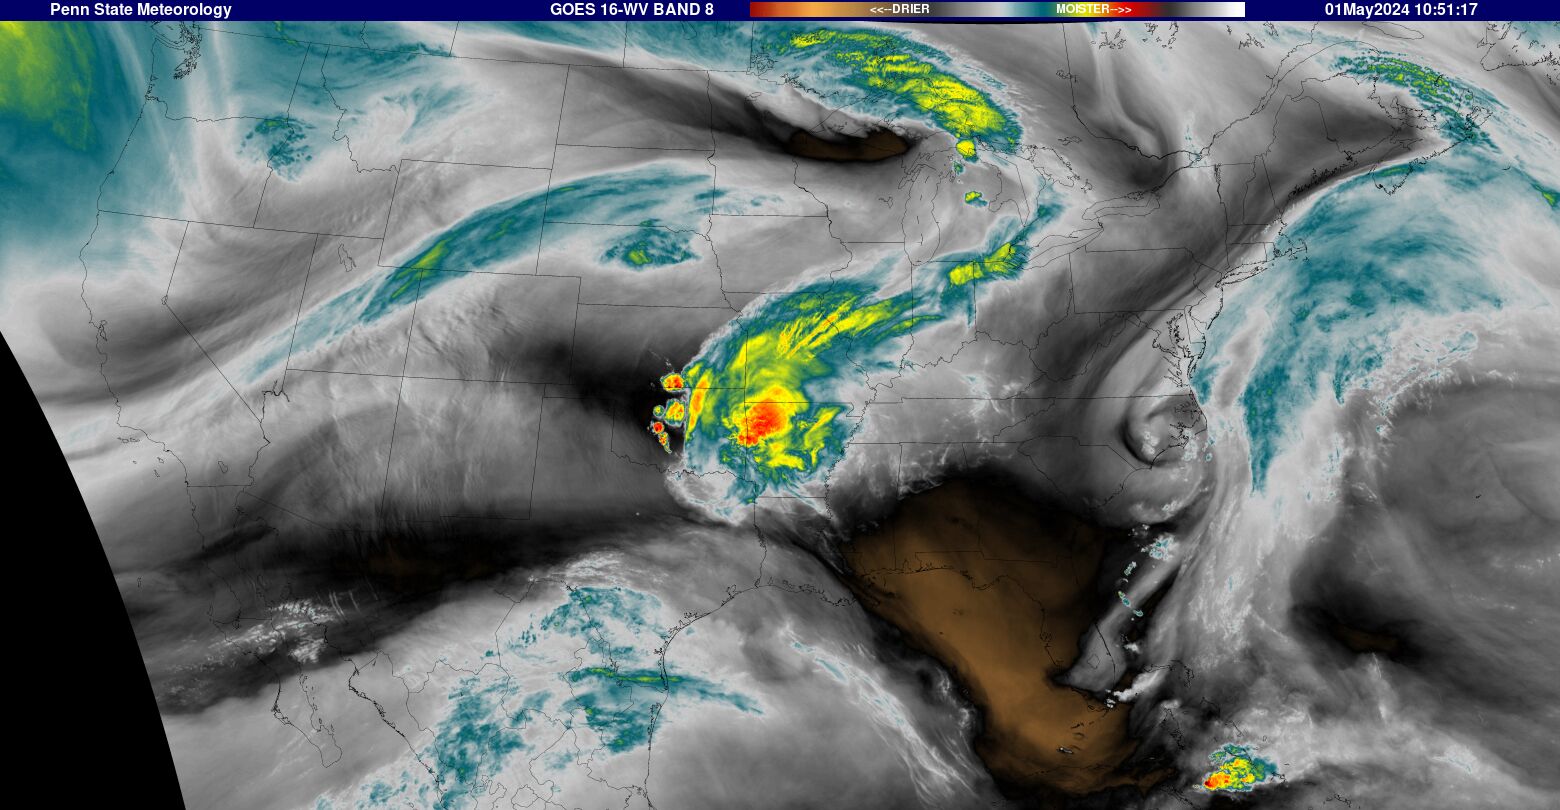
Water Vapor Weather Satellite Images
This satellite imagery represents a special kind of infrared measurement which measures the temperature of clouds and water vapor in a layer of the atmosphere about 6-10 km above the surface. At this altitude, steering currents such as jet streams control the movement of weather systems around the Earth. The water vapor imagery therefore captures these jet streams (elongated dark regions with adjacent clouds and bright regions), "dry" blocking high pressure systems (dark regions), and other weather systems (gray and bright white cloud patterns). By studying these features and tracking them over time, meteorologists can produce more accurate weather forecasts.